Dedicated and Cloud Hosting Comparison: AWS, Azure, Google Cloud, Vultr, LiquidWeb
A-Team Systems works with dozens of different hosting providers in almost every environment conceivable. In a unique way this broad experience has given our engineers an inherent “gut feeling” on the performance of these providers and how they compare to each other.
The primary goal of this benchmark and hosting review is to replace that “gut feeling” with concrete, reproducible, and comparable numbers which we can share directly with you.
Using these numbers, we hope to give you high level insight into the value each provider delivers, focused on the most common use case we see for our customers: Web application performance.
Value Per Dollar
To do this we will focus on “value per dollar” numbers, centered around a typical real-world web server usage model (i.e.; PHP and MySQL) as well as typical subsystem benchmarks (CPU and I/O).
Because no hosting provider lets you pick, to the dollar, how much to spend, comparing offerings requires dividing the monthly cost of the server or instance by its performance.
In this way we can directly compare the value each instance gives you for every dollar you are spending.
Servers and Instances Tested
We targeted these instances to be as close to $200 per month as possible. As you can see there are some which are significantly more expensive due to minimum spend or instance size rules. Again, our goal is a value per-dollar figure so variation in cost does not affect our findings.
| Name | CPU Cores | RAM | Disk | Transfer BW | Mo. Cost |
|---|---|---|---|---|---|
| Vultr Cloud Compute | 8 | 32 GiB | 640 GB | 6 TiB | $160 |
| LiquidWeb Dedicated | 41 | 16 GiB | 240 GB2 | 5 TiB | $199 |
| Google Cloud | 8 | 30 GiB | 200 GB | 1 TiB3 | $222 |
| AWS m5.xlarge | 4 | 16 GiB | 200 GB | 1 TiB3 | $320 |
| Azure | 4 | 16 GiB | 256 GB | 1 TiB3 | $250 |
| AWS t2.xlarge | 4 | 16 GiB | 200 GB | 1 TiB3 | $242 |
2 2x 240 GB SSDs RAID 1 (mirror).
3 For AWS, Azure, and Google Cloud we provisioned the instances with 1 TiB of bandwidth transfer as a minimum, as they don’t come with internet transfer by default.
All instances and servers (including LiquidWeb dedicated) are on-demand with no contract commitment, reserved, or similar pricing discount.
Test Setup
To test each instance type we used the exact same software configuration for each instance, except for the base OS image which we leveraged the following baselines:
For cloud servers we used each provider’s off-the-shelf base OS image for Ubuntu 16.04. That way any things like CloudInit and other provider needed software was present. This represents a typical real-world experience for the average deployment in our view.
For dedicated servers we used the stock Ubuntu 16.04 install ISO and configured the disks with a software RAID 1 (mirror) using the Ubuntu installer.
Benchmarks and Methodology
Our objective was two-fold in our testing: The first was to create a reproducible test that represented a typical hosted web application, since that is the most common use case we see for our customers. This will let us compare at a high level the overall performance of an instance.
The second was to measure raw CPU and I/O numbers for a more specific comparison and to see what contributed (or detracted) from the above overall application performance.
Each test was run continuously for 24 hours before metrics were recorded into our results. This was done to defeat and ‘smooth out’ any burst capacity a provider may offer since it does not represent a consistent performance metric.
Application (WordPress)
To provide a real-world combined “application performance” figure we created a standard image of a WordPress site (files and DB) with a few hundred pages. This was installed and configured identically on each test instance.
We used the default version of Apache (2.4), MySQL (5.7) and PHP (7.0, using PFP-FPM + FCGI) on Ubuntu 16.06 from Ubuntu’s own repositories.
No tuning was done to the OS, WordPress, Apache, MySQL, or PHP outside of what ships with Ubuntu 16.06 or WordPress. This was intentional to keep the baseline flat and provide a good ‘bedrock’ value on performance without things like caching affecting the results.
For this reason, the WordPress performance results should not be taken as a real-world performance expectation of WordPress itself. Instead it is a way of standardizing high-level web application performance into a benchmark to compare these instances.
You may wish to skip to the primary results if you are not interested in the specific commands we ran for these benchmarks:
The WordPress benchmark was conducted using the Apache HTTP server benchmarking tool ‘ab’ running locally as to avoid any internet related performance variation.
The following commands were run in a loop for 24 hours, at which time the best time out of the last 3 results were picked for each -c value:
ab -n 10000 -e wp025.csv -c 25 http://127.0.0.1/ >> wp_bench.HOSTNAME.out && sleep 60 &&
        printf "\n\n" >> wp_bench.HOSTNAME.out &&
        ab -n 10000 -e wp050.csv -c 50 http://127.0.0.1/ >> wp_bench.HOSTNAME.out && sleep 60 &&
        printf "\n\n" >> wp_bench.HOSTNAME.out &&
        ab -n 10000 -e wp075.csv -c 75 http://127.0.0.1/ >> wp_bench.HOSTNAME.out && sleep 60 &&
        printf "\n\n" >> wp_bench.HOSTNAME.out &&
        ab -n 10000 -e wp100.csv -c 100 http://127.0.0.1/ >> wp_bench.HOSTNAME.out
CPU (SysBench)
We used SysBench 1.x tool’s CPU and memory throughput benchmarking tests, from the “akopytov” repository as Ubuntu 16.06’s version is the older 0.x version.
The runs performed were:
# --- CPU Run 1 Core
        sysbench cpu --cpu-max-prime=1000000 --time=30 --threads=1 run >> sysbench.HOSTPROVIDER.out

        # --- CPU Run  Core
        sysbench cpu --cpu-max-prime=1000000 --time=30 --threads=4 run >> sysbench.HOSTPROVIDER.out
        # (replace with core count)

        # --- Memory (threads shouldn't matter)
        sysbench memory --memory-block-size=512M run >> sysbench.HOSTPROVIDER.out
I/O (FIO)
We used the FIO tool to benchmark the following: sequential read, sequential write, random read, and random write. Each operation was performed with a work size of 2x configured RAM. Each operation was tested separately over 3 runs with 30 seconds separating each run.
Primary Results
We will focus on how much “one web request per second” worth of performance costs (per month) for each instance. This is the monthly cost divided by the benchmarked requests per second value of the instance.
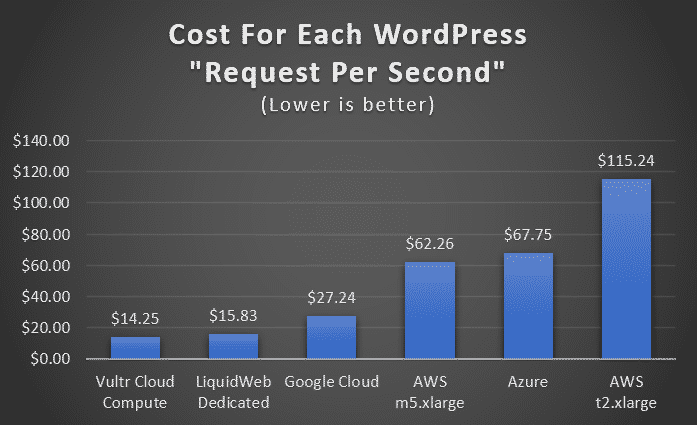
From the graph it is immediately clear that Vultr Cloud Compute and LiquidWeb’s dedicated servers provide exceptional and almost identical value per dollar.
Google Cloud comes in at almost half the value but is still miles ahead of AWS and Azure which are 3x-8x more expensive than Vultr.
Secondary Results
To gain more insight into what produced such a profound value gap we can look at the raw CPU and I/O performance numbers:
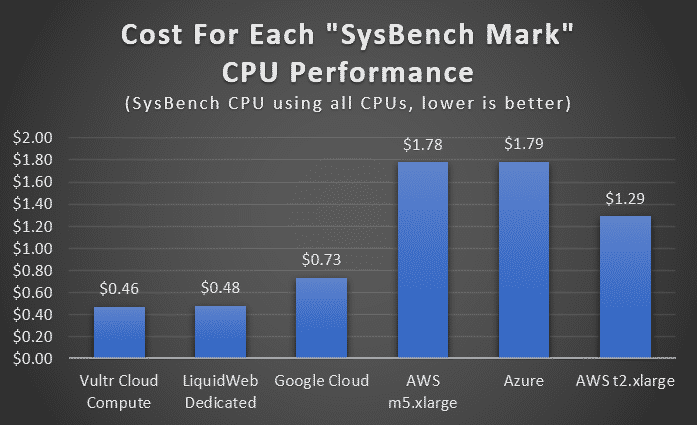
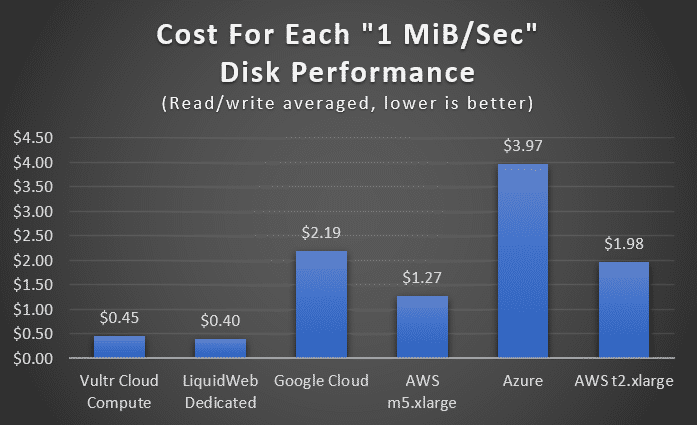
There are no surprises here, with CPU value being in line with the “one web request per second” value. The exception being that the AWS t2.xlarge instances do provide some better value in specific CPU and I/O workloads vs. the m5.xlarge instances being a better value at the high-level WordPress application test.
You can also see (in the table below) how poor I/O performance hurts a lot of these instances on AWS, Azure, and to some extent Google Cloud. These can be upgraded, but at even more cost.
We hope that these both help explain what contributed to the primary results as well as assist you in picking a provider if you have a specific performance requirement for CPU or I/O intensive workloads.
Please do read further on our overall conclusions though!
Raw Data
Below is a complete breakdown on all the benchmarks we collected:
| Name | CPUs | RAM | Cost/Mo. | Mem. Speed | 1 Thread | All Threads | Seq. Read | Seq. Write | Rnd. Read | Rnd. Write | WP Req Rate |
|---|---|---|---|---|---|---|---|---|---|---|---|
| Vultr Cloud Compute | 8 | 32 | $160 | 152 | 50 | 345 | 342 MiB/sec | 371 MiB/sec | 324 MiB/sec | 370 MiB/sec | 11 req/sec |
| LiquidWeb Dedicated | 4 | 16 | $199 | 200 | 72 | 416 | 803 MiB/sec | 241 MiB/sec | 820 MiB/sec | 151 MiB/sec | 13 req/sec |
| Google Cloud | 8 | 30 | $222 | 174 | 49 | 304 | 99 MiB/sec | 99 MiB/sec | 104 MiB/sec | 104 MiB/sec | 8 req/sec |
| AWS m5.xlarge | 4 | 16 | $320 | 197 | 57 | 180 | 250 MiB/sec | 254 MiB/sec | 254 MiB/sec | 252 MiB/sec | 5 req/sec |
| Azure | 4 | 16 | $250 | 123 | 46 | 140 | 63 MiB/sec | 63 MiB/sec | 63 MiB/sec | 63 MiB/sec | 4 req/sec |
| AWS t2.xlarge | 4 | 16 | $242 | 148 | 47 | 188 | 122 MiB/sec | 122 MiB/sec | 123 MiB/sec | 123 MiB/sec | 2 req/sec |
Considerations
It is easy see that Vultr’s Cloud Compute and LiquidWeb’s dedicated servers are the best value for each dollar spent in terms of performance.
However, you are looking at more than just raw performance when you opt for a provider. That premium being worth it is something you as an organization need to decide consciously, otherwise you may be paying a massive premium for no practical gain.
With that in mind a few things should be considered with these results:
Instance Sizing
All providers let you pick various instance and server CPU cores, RAM, and disk, however some are much more flexible than others.
Vultr
The first example of this is Vultr, which allows you to simply double the CPU, RAM, and disk space every time you need something bigger. This simplifies their pricing but makes it so your cost doubles — even if you just needed a little bit more RAM, for example. Vultr does offer a adjustable block storage service in their NJ datacenter but it is not ready for critical workloads in our view (as of writing this, Sept 2nd, 2020).
LiquidWeb
The LiquidWeb dedicated servers are bound by the “laws of hardware”, allocating CPU, space and RAM based on available memory DIMM and SSD sizes.
Google Cloud
Google Cloud has pre-defined instance sizes but also lets you specify your own configuration with the greatest amount of granularity out of all the providers. Disks can be configured to the GB, with CPU and RAM being configured independently as well (with some limitations).
AWS and Azure
AWS and Azure have a complicated and comprehensive spread of instances that let you spec almost any CPU, RAM, and disk size combination you want. However, as you can see this precision comes at a cost that likely negates that value, since you are paying such a high premium for their instances from the start.
Ecosystem and Use Case
In our view ecosystem is where that premium may become worth it, depending on your use case and scale.
If you are looking at a mostly homogeneous orchestrated environment, using tools like Foreman or Terraform, having a good standard interface into instance management is important. This also means you have the expertise in house or contracted to realize this goal.
Vultr provides an API, but is not compatible with these tools, for example. So, to leverage their dynamic provisioning you are looking at some custom development.
And a LiquidWeb dedicated server obviously cannot be created from thin air on demand (meaning there is a lead time on adding and removing servers).
This is where Google Cloud, Azure and AWS are unique in their offerings vs. the others. Provisioning tools support them out of the box with no custom development needed.
Database Services, Elastic Provisioning, Block Storage
Database-as-a-service (i.e., RDS), auto-scaling, and so forth are specific to Google Cloud, Azure and AWS. Only they provide you with that advanced ecosystem.
For our smaller clients and deployments, it is rare in our experience to see these services leveraged at all (or properly). And their cost effectiveness is also, in our view, subject to debate as well (and perhaps another benchmark review of its own).
High Availability and Scaling
One of the biggest misuse of cloud providers we see is that people move to AWS or Azure expecting things like autoscaling, high availability and so forth to just happen implicitly, without realizing that their application and workload needs to be redesigned for it.
AWS is a particularly poor choice for ‘ad-hoc’ instances such as one (or a few) web server + one (or a few) DB server type setups. There is no console access if something breaks with the OS and it won’t boot or come up on the network.
AWS is very much designed around your instances being homogeneous, disposable, and having them destroyed and re-created if there is a problem. This is possible when your data is in things like RDS and so forth, and not on your actual compute instances. It is not possible when you have a web server with your data on it.
Most providers, including LiquidWeb, now deliver common infrastructure services like load balancing, NFS volumes, and S3-compatible storage. These two are the most common infrastructure needs we see and help close that gap against AWS, Azure and Google Cloud.
Flexibility/responsiveness
Dedicated servers cannot be instantly provisioned and de-provisioned the way cloud servers can be. In our experience though, the few days of lead time needed are not a problem. The premium (or lack of value) with Azure or AWS means auto-scaling up and down on them is likely more expensive than keeping static capacity hot at Vultr or LiquidWeb. It can make sense in some cases but in our experience, it is rare for the average customer to take advantage of this properly. On top of the expense it also adds a lot of complexity to an environment.
Hardware Overhead and Commitments
One of the most common questions we get regarding cloud vs. dedicated is “isn’t hardware more work to manage?”. The short answer is “no”. Almost all of the complexity in managing a server (dedicated or cloud) is in the operating system and the software running on it, so it really is no different either way.
Cloud providers still run hardware, and when their hardware has problems it can be considerably more difficult to troubleshoot because you don’t have direct access to see exactly what is going on.
Finally, a lot of customers we hear from are under the impression that dedicated servers implicitly come with a year or more commitment or contract. With LiquidWeb (and other hardware providers) this is not the case. Gone are the 1990s of having to sign a three-year (or even one year) lease on a server for most dedicated providers. Rackspace is still one of the few still doing this, but they are an exception at this point.
Most providers have moved to a HaaS (“Hardware as a Service”) model to give you the same spending flexibility you would expect from a cloud provider with the value of dedicated infrastructure. Spin up and down servers as you need.
Bandwidth
You may have noticed that only Vultr and LiquidWeb provide more than 1 TiB per month of transfer built into their instance pricing. That is something to consider as well: It is not uncommon for bandwidth intensive applications to have more bandwidth than compute costs at AWS. This can really stack up when using things like CloudFront in combination with S3.
Final Conclusions
The WordPress graph speaks for itself:
For the best performance per dollar Vultr, LiquidWeb, and to some extent Google Cloud are your best bets.
Azure and AWS comparatively are 3x-8x more expensive for the same performance.
In our view it is hard to overcome that gap with better instance sizing and supporting ecosystem unless you can truly take advantage of it in a cost-effective manner. This typically means a large, homogeneous deployment and significant developer resources and/or provider lock in.
If you are considering AWS or Azure: Be honest with yourself about how much of that ecosystem your organization will use, and if it is worth the massive premium. Is it enough to justify 3x-8x spend on compute resources, along with spending the time on something other than your actual application or product?
A-Team Systems is here to help you evaluate these options, inform your business decisions, and leverage whichever provider you decide on to their fullest!
Finally, thank you for taking the time to read this post. It has been a project spanning many months to get all these instances reliably tested and the data organized. We hope this helps you and your organization – and do not hesitate to contact us if you have any questions or want to talk!
Need help with Linux or FreeBSD infrastructure?
A-Team Systems provides engineer-led support for production Linux and FreeBSD environments, including troubleshooting, operational oversight, and ongoing infrastructure management.
Contact A-Team Systems