Today A-Team Systems formally announces the latest edition to all maintenance and monitoring plans: Complete integration with New Relic application monitoring and metrics.
We’re particularly excited about this as New Relic is the standard for application monitoring and is an excellent tool for driving optimization of code, database and systems infrastructure.
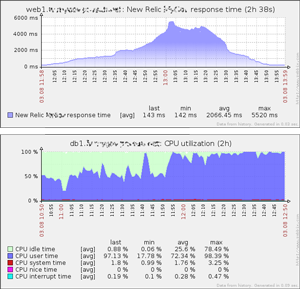
Unified Monitoring
Foremost A-Team systems’ staff can now see an even more complete picture of your applications on our dashboards ensuring any issues are quickly identified and reducing the time to correct them. This is especially true for situations where traditional monitoring would not show any problem such as overall application slowness or in deep areas of large applications that might not be directly monitored at all simply due to the size of an application.
New Relic’s systems are based around the complete picture inside the application and complement our unrivaled systems and networking monitoring perfectly. This combined visibility also lets us work better with your developers to enhance performance and stability.
On-Call Alerts
On-call customers can choose to have New Relic apdex, response and other metric alerts trigger page outs for both application sets and key transactions (as defined in New Relic), providing true end-to-end alerting for any issues affecting user experience, not just it’s underlying systems.
Deployment Integration
Lastly our automated staging and production deployment system reports deployment actions to New Relic. This means deployments are logged within New Relic and performance for each deployment can be tracked and compared with others.